Module 1: Fallow Simulation
IMPORTANT NOTE: It is highly recommended that you upgrade your APSIM Next Gen version to at least version 2023.2.7164.0 or later.
We will create a simulation that examines the water balance over time in a fallow field in two locations with different soil types.
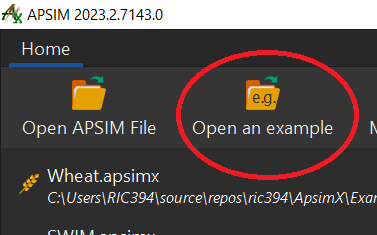
In the top menu bar, click on "Open an example".
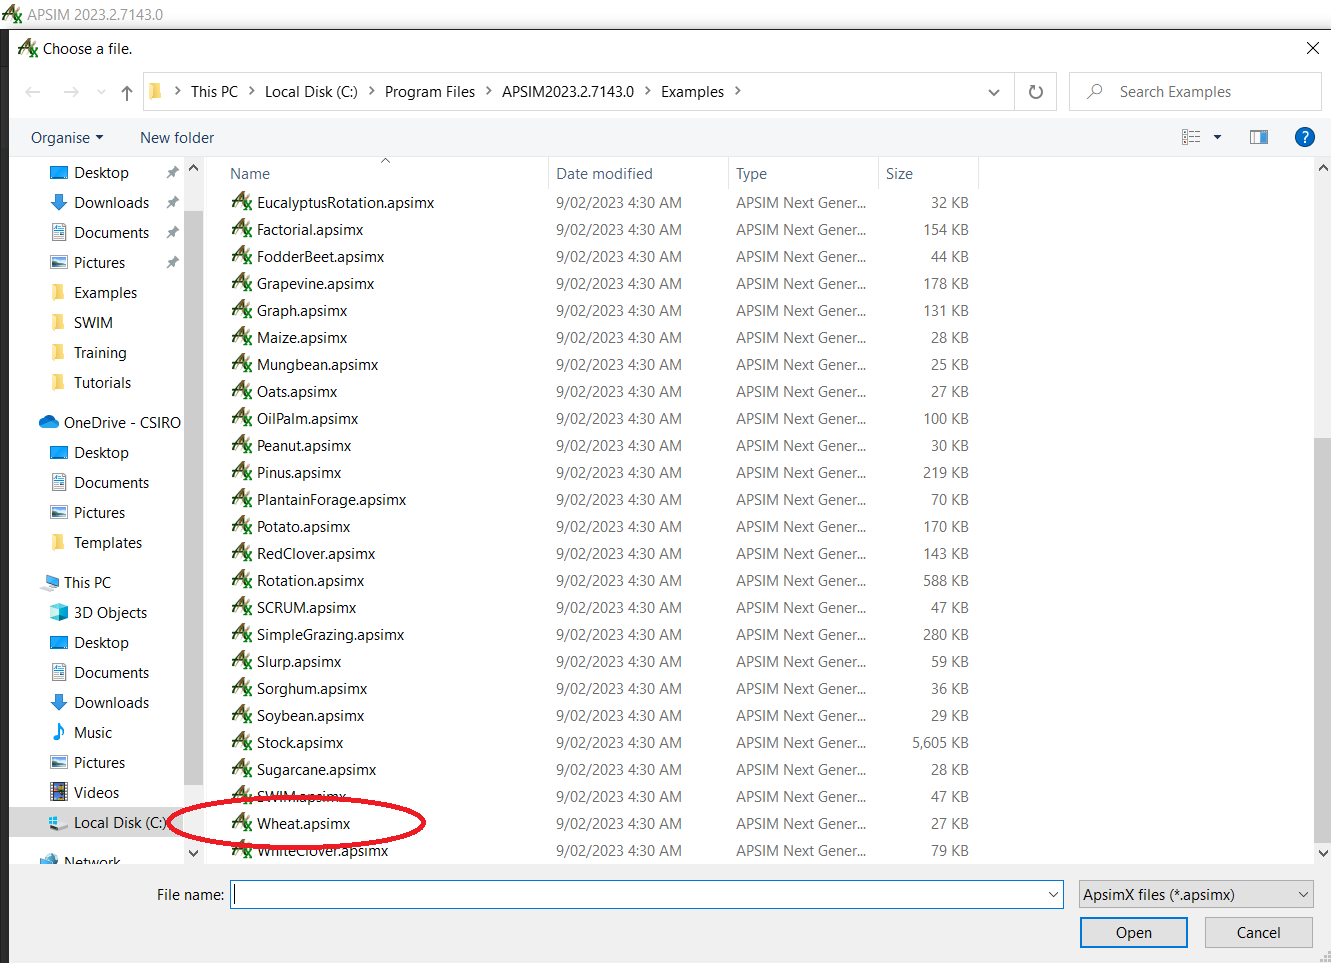
Because all simulations generally share the same base components, we do not recommend starting from scratch. The best method is to choose the simulation closest to the one you want to build then modify it. For the purpose of this exercise we will use the Continuous Wheat simulation. Click ‘Wheat.apsimx’ then click Open.
Select "Wheat.apsimx".
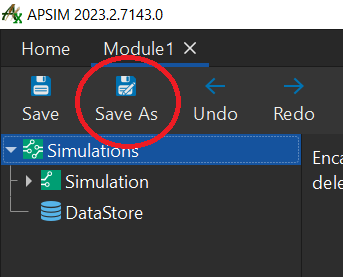
Click Save as.
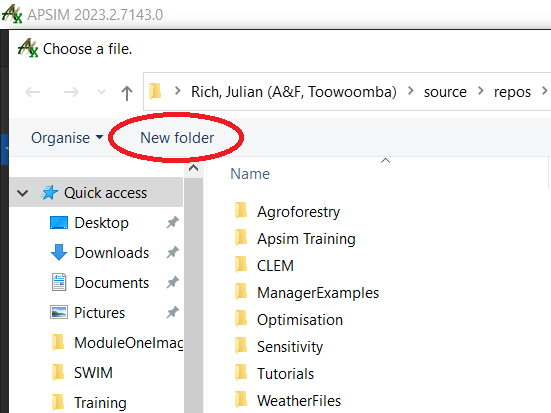
Create a new folder called ‘Apsim Training’ to save all of your work in.
- Remember this location, as you will save all training modules to this location. Save the file as "Module1". You will now see the new simulation loaded.
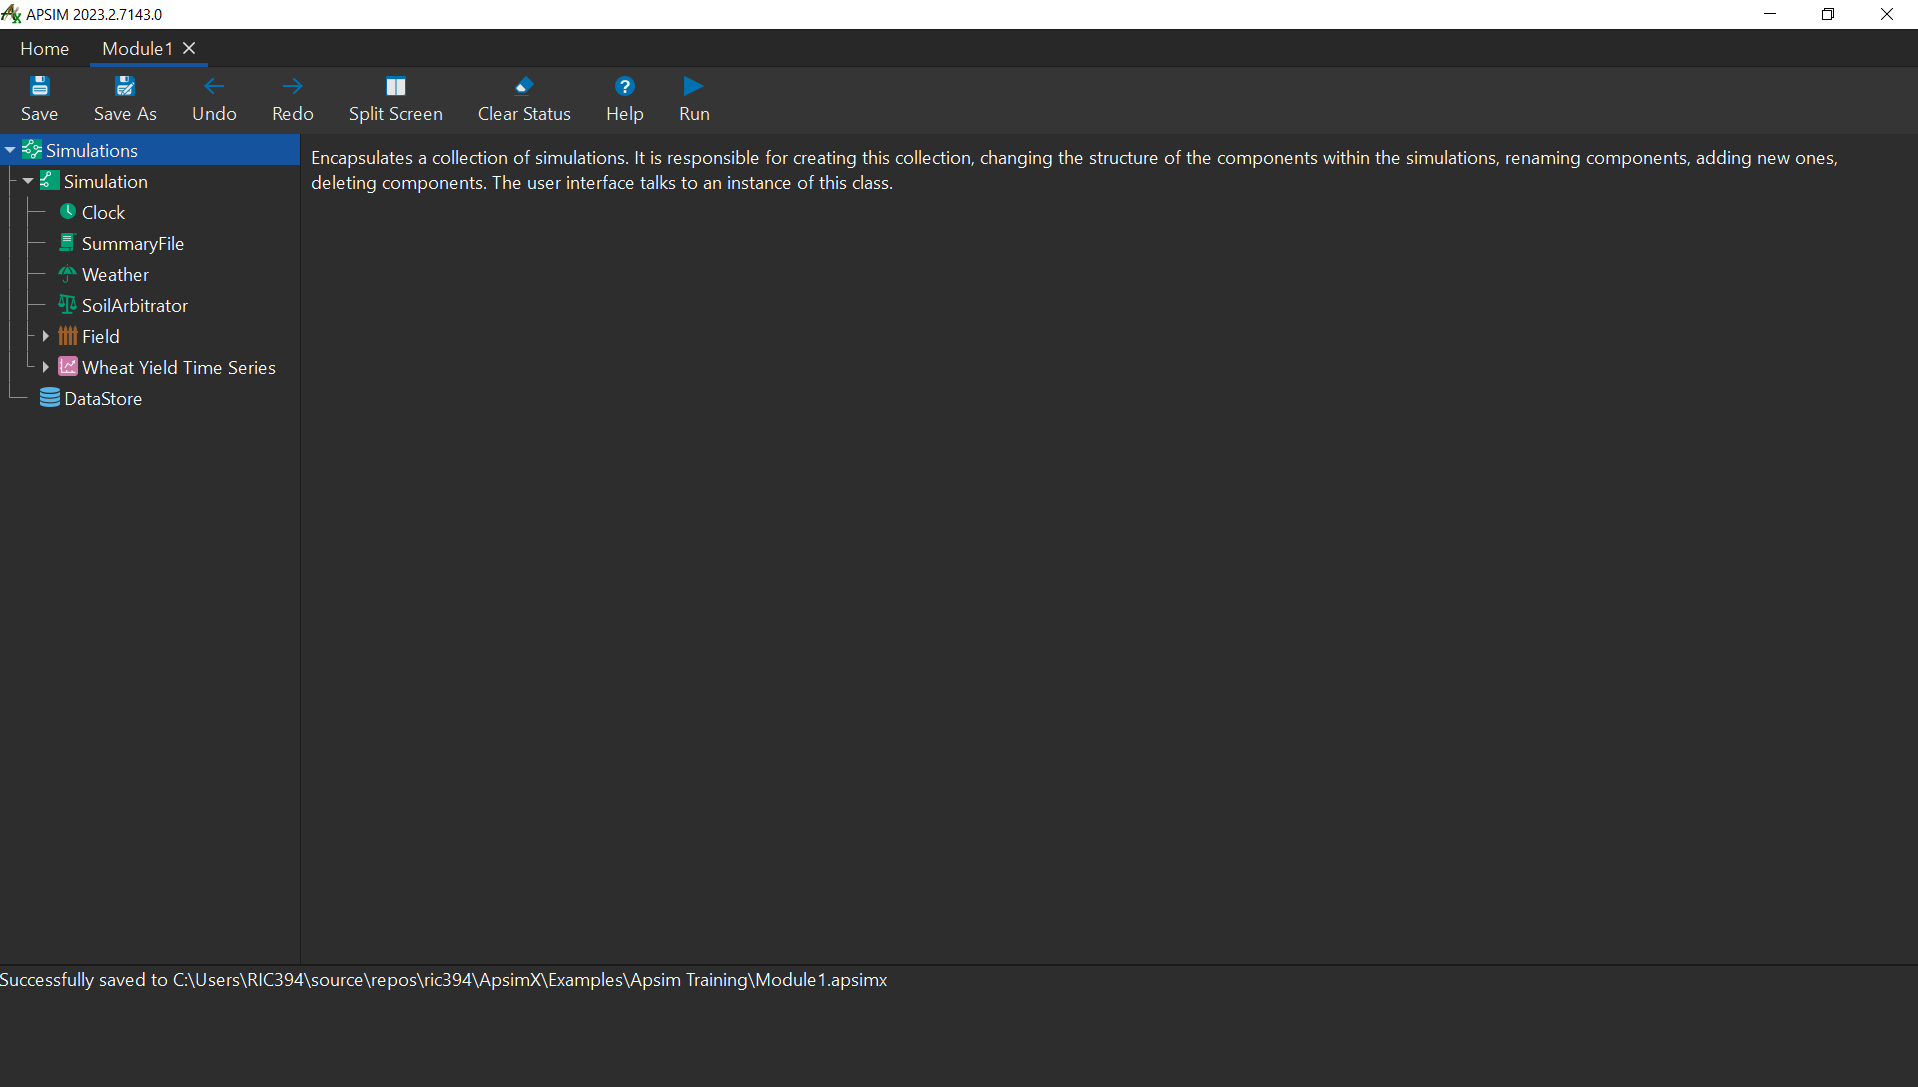
The Apsim UI consists of four panels; the main toolbar at the top, a simulation tree on the left that lists all the components in the loaded file, a module properties pane on the right and a bar at the bottom that displays messages.
Building a simulation
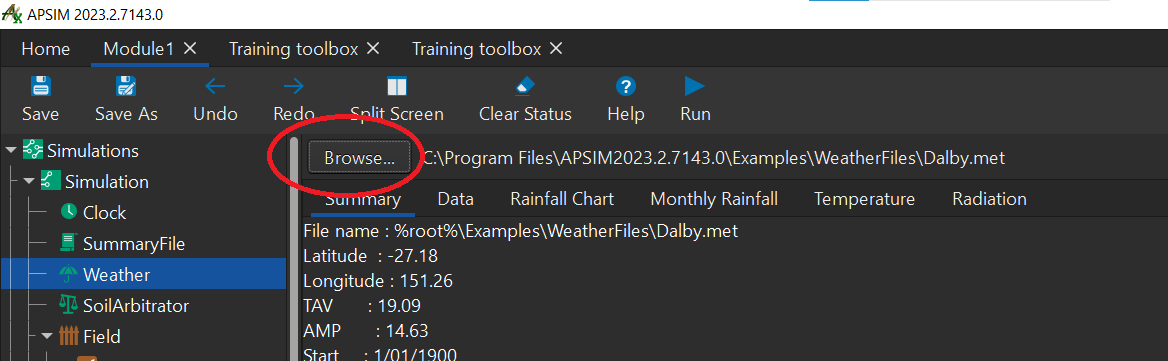
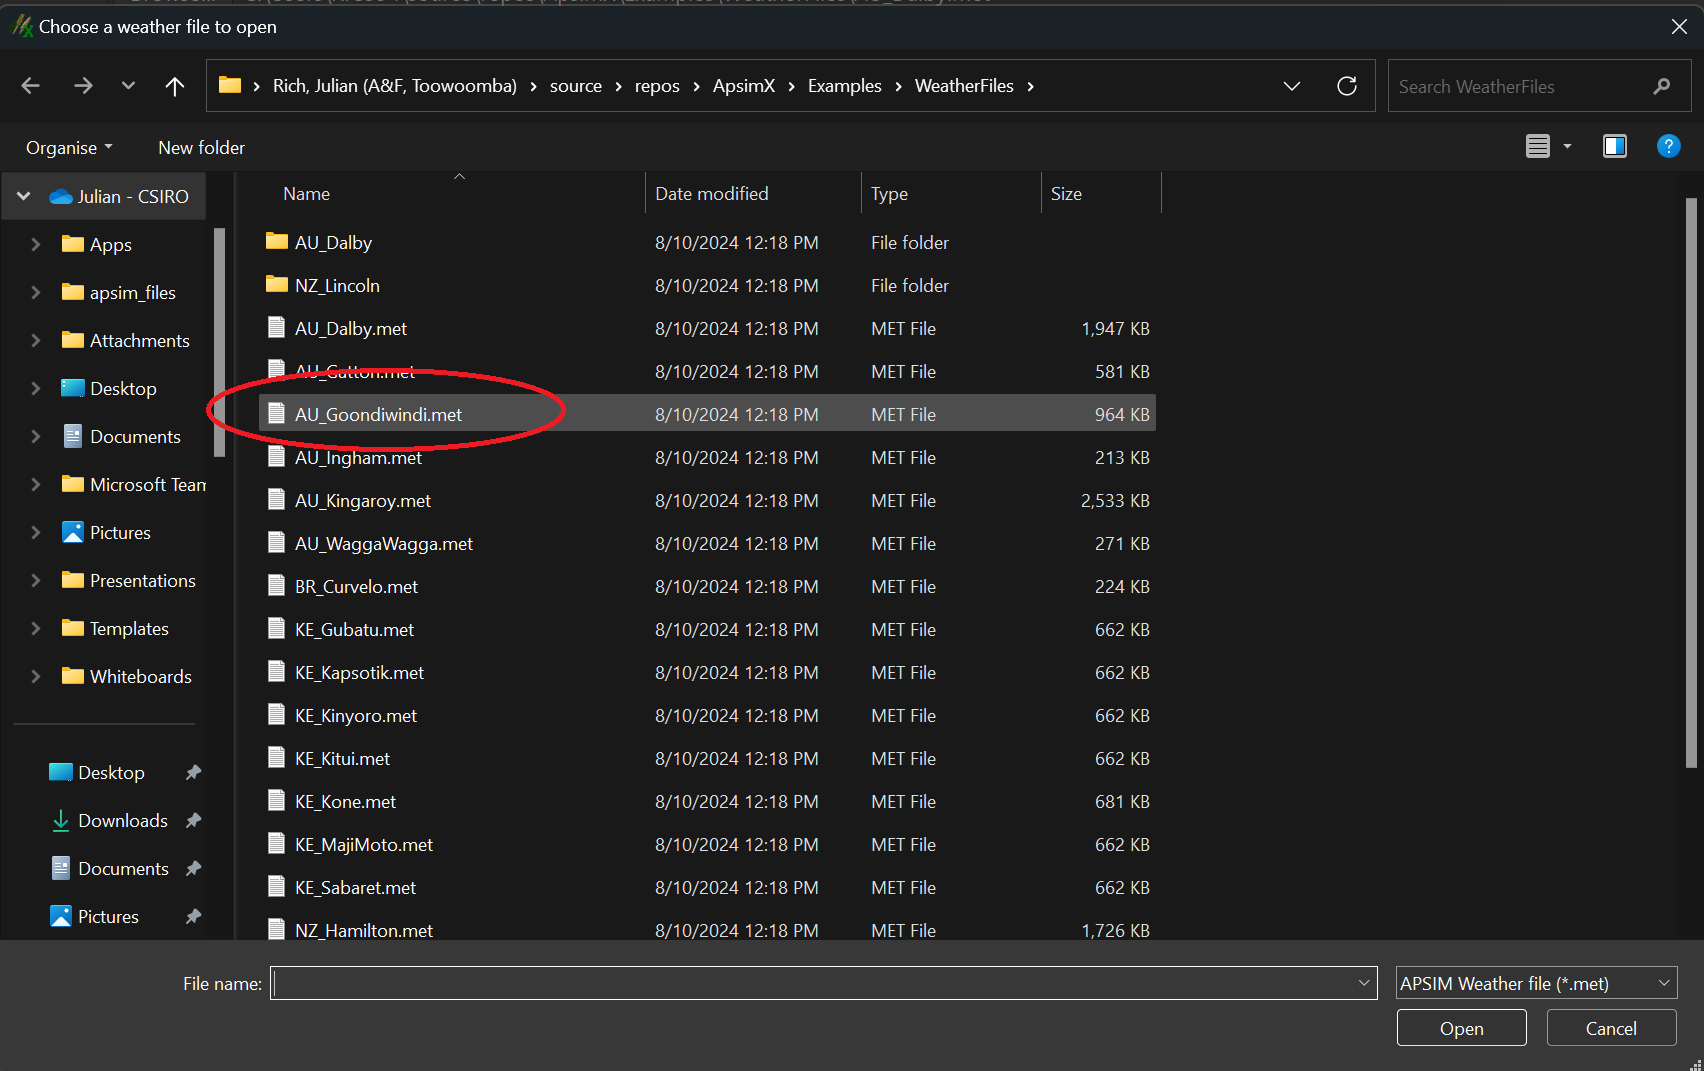
First we will make sure we’re using the right weather data. Click the "Weather" component in the simulation tree. You should be able to see weather data for Dalby loaded. Click browse and select "AU_Goondiwindi.met" to change it to Goondiwindi weather.
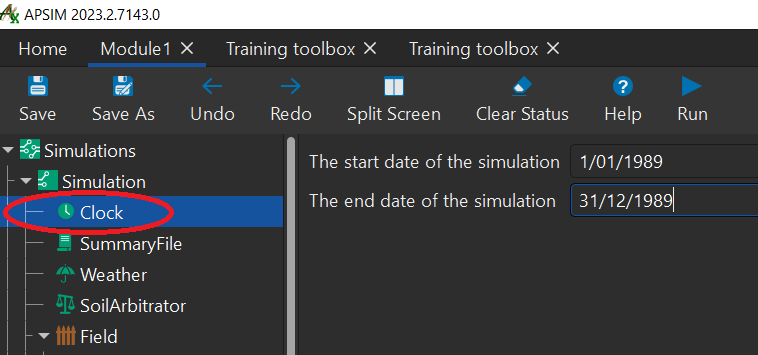
Next we’ll set the start and end dates for the simulation. In the clock component, set the start date to 1/1/1989 and the end date to 31/12/1989.
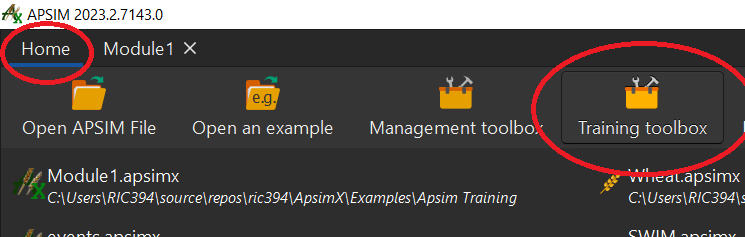
We are going to utilise a pre made toolbox to make it easier to access some soil data. In APSIM Next Gen, you can access this by:
- Clicking 'Home'
- Then clicking "Training toolbox" from the menu bar.
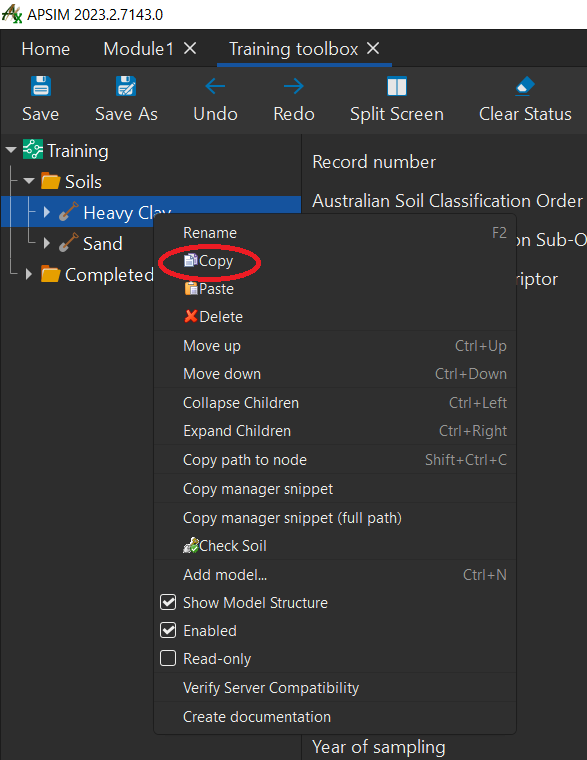
Inside the training toolbox double-click "Soils".
Right-click the "Heavy Clay", click copy.
Next Click "Module 1". This is located above the menu bar. This will take you back to your Module 1 simulation view.
Next, right-click "Field" and click "paste" from the menu that appears.
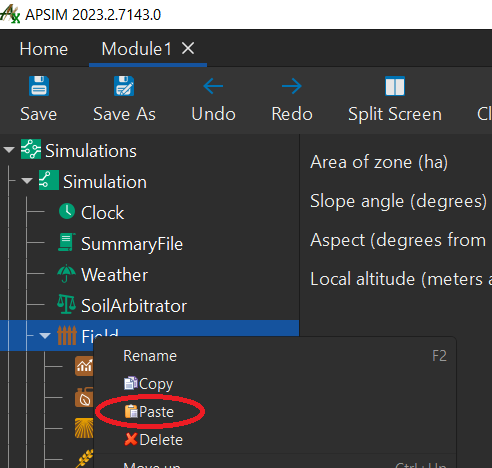
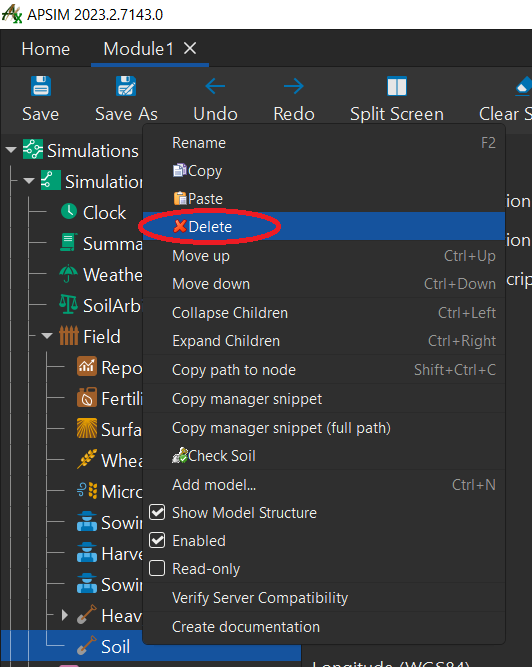
Delete the old soil by clicking it and pressing delete. You can reorder components by right clicking and choosing Move Up/Down (Keyboard shortcut: Hold ctrl + up or down keys).
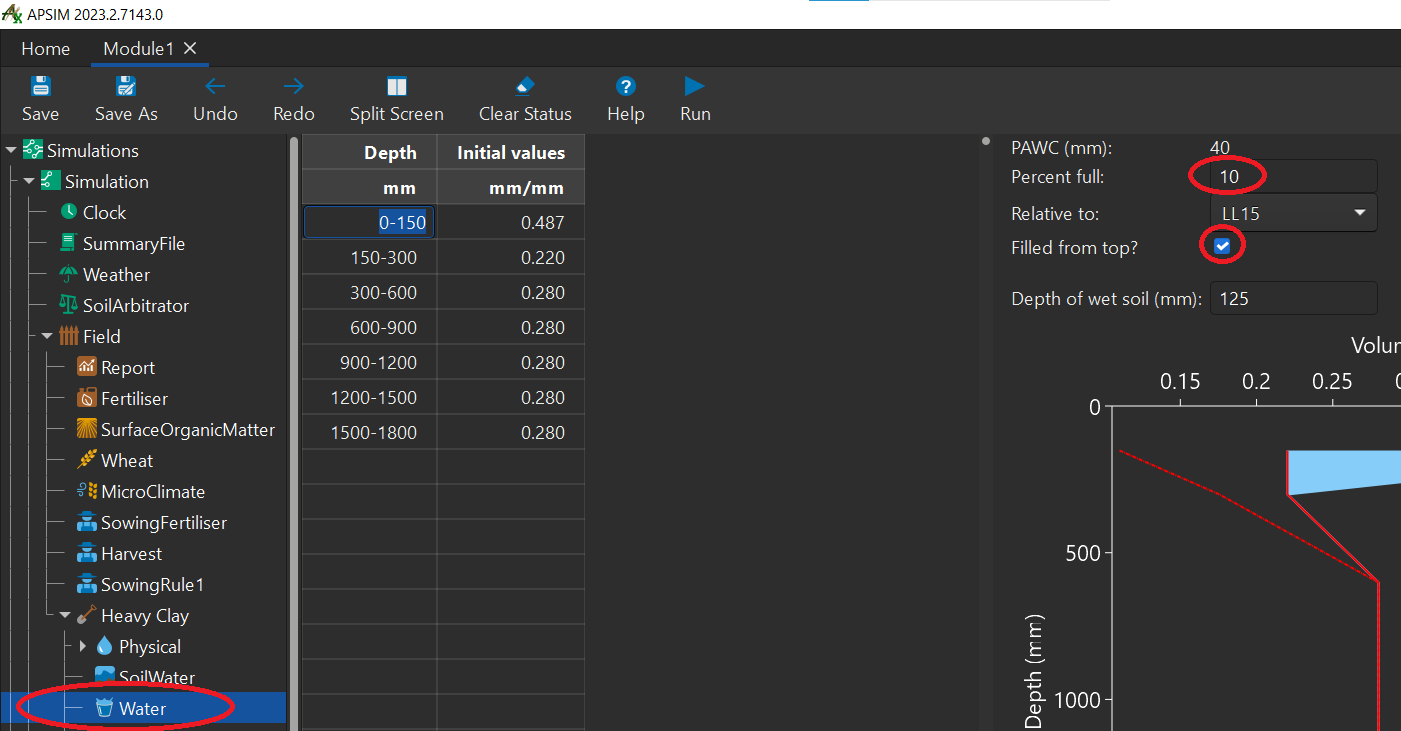
We need to set the starting water and nitrogen conditions for the soil. Expand the new soil node "Heavy Clay" and click "Water". Make sure "Filled from top" is checked and set "Percent full" to 10%.
Click the "NO3" component and set the starting NO3 to 50 kg/ha and starting NH4 to 3 kg/ha. We’ll spread it evenly through the entire soil profile. First, we need to tell Apsim that we want to work in units of kg/ha, not ppm.
- To change the units, right-click the "initial values" cell and select "kg/ha"
- Change NO3 and NH4 to kg/ha then enter the values below.
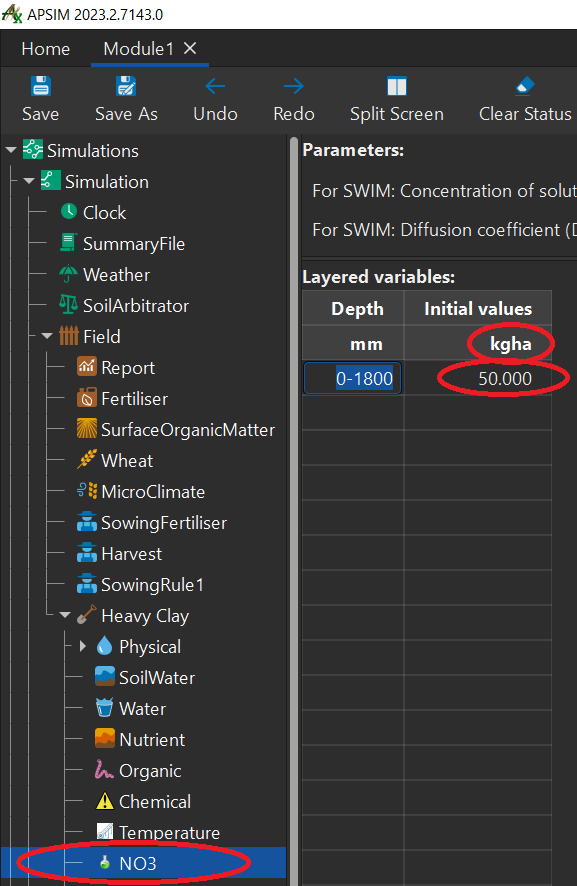
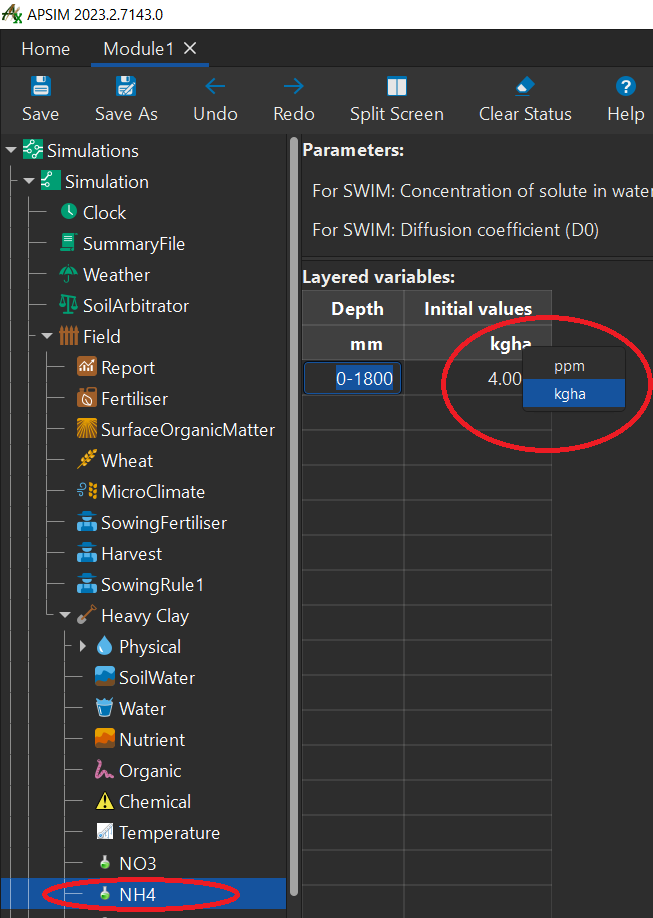
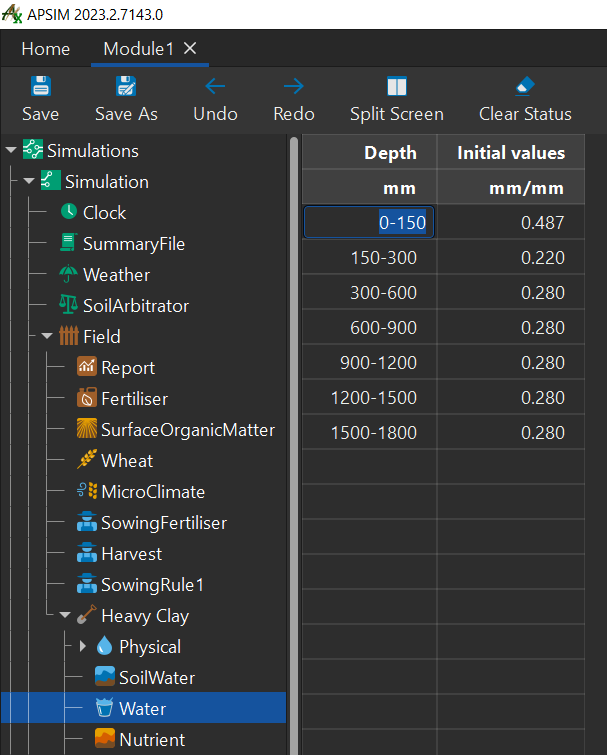
- We want the nitrogen spread evenly through the entire soil profile. To find out how deep the profile is, click the Water node under Soil. The table should show layers ranging from 0-150 to 1500-1800mm. As the depths are not set correctly we will modify NO3 and NH4's depth values to 0-1800.
In the SurfaceOrganicMatter node, check that the ‘Type of initial residue pool’ is wheat and change the ‘Mass of initial surface residue (kg/ha)’ to 1000 kg/ha.
- To do this click in the cell to the right of "Mass of initial surface residue (kg/ha)".
- Then change the value from 500 to 1000.
This means we start the simulation with 1000kg/ha of wheat stubble on the surface. This will decay over time putting nutrients back in the soil. It will also reduce surface evaporation.
Delete the Fertiliser, Wheat, and three Manager nodes: Sow using a variable rule, Fertilise at sowing and Harvest, as we do not need them for a fallow simulation.
- To do this right click each manager node
- Then click delete.
- These nodes have this icon:

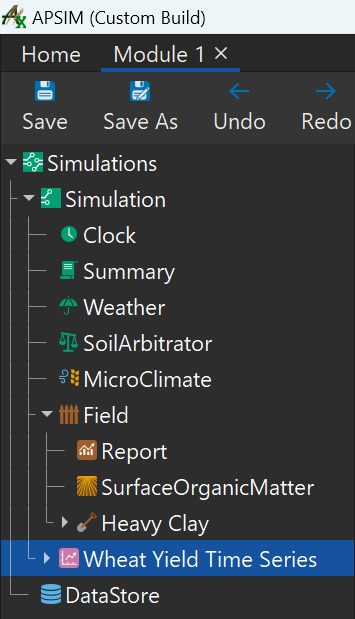
It should now look like this:
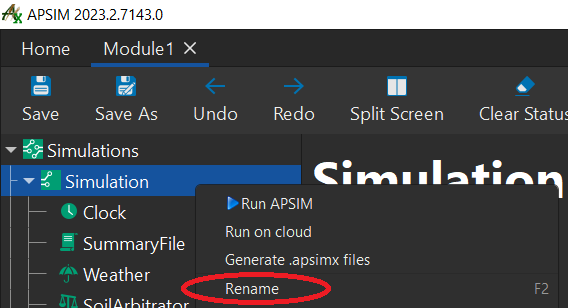
Rename the simulation. To do this:
- Right-click the Simulation node under Simulations.
- Click ‘rename’.
- Type in ‘Clay Fallow’ and press enter.
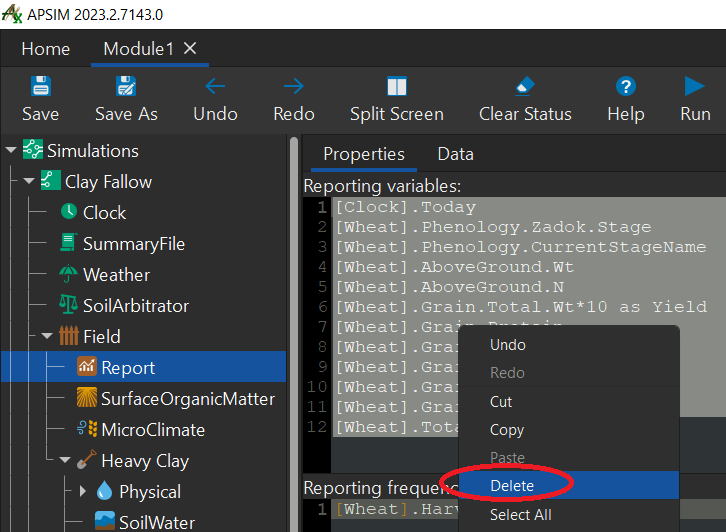
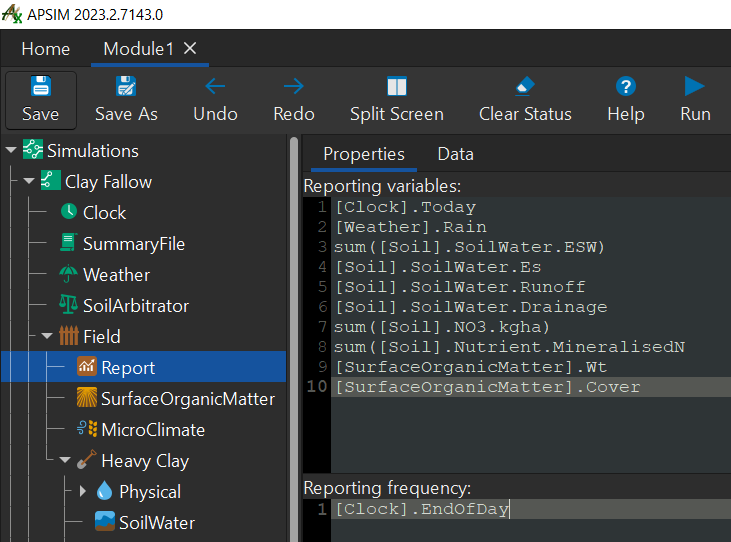
Results for the simulation are found in the ‘DataStore’ node. The data that is reported into the datastore is configured in the "Report" node, found under the "Field" node. Click the "Report" node and delete all the Variables under the "Reporting variables" section. To do this:
- Highlight all the text.
- Right-click the highlighted text and click "delete".
Next we will enter the variables we want reported. These are:
[Clock].Today
[Weather].Rain
sum([Soil].SoilWater.ESW)
[Soil].SoilWater.Es
[Soil].SoilWater.Runoff
[Soil].SoilWater.Drainage
sum([Soil].NO3.kgha)
sum([Soil].Nutrient.MineralisedN
[SurfaceOrganicMatter].Wt
[SurfaceOrganicMatter].Cover
Where Reporting frequency displays the variable :
[Wheat].HarvestingReplace with the variable by typing:
[Clock].EndOfDayYour report view should now look like this:
You can choose a regular interval such as every day or once a month/year, etc, or you specify an event.
For instance you might want to output on sowing, harvesting or fertilising. You can have multiple events in a report but this will result in duplicated writes if a day meets both criteria.
For this simulation we want to output daily so we've used:
[Clock].EndOfDay.- We've finished building the simulation.
- Click
runbutton in the menu bar. The bottom panel will display a message likeSimulation complete [.09 sec]. - Once the run is complete, click the ‘DataStore’ component to view the results.
- This information can be exported as a spreadsheet by:
- right-clicking "DataStore" node
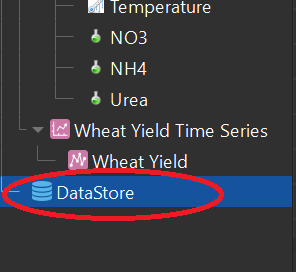
- click "Export to EXCEL"
- This will be saved as "Module1.xlsx" in the same folder you saved your "Module1.apsimx" file.
- or "export output to text files".
- This will be saved as "Module1.Report.csv" in the same folder you saved your "Module1.apsimx" file.
- right-clicking "DataStore" node
- Click
- We've finished building the simulation.
Creating a graph
Apsim has the ability to do basic visualisation and analysis right in the user interface. Let’s use the inbuilt APSIM graphs to display the output file in a graph.
We will create a graph of Date vs ESW and Rain(Right Hand Axis).
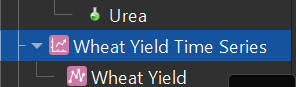
First lets delete the existing graph called: "Wheat Yield Time Series" by right-clicking the node and clicking "delete".
Next lets create a new graph for this simulation.
- Right-click "Clay Fallow"
- Click "add model"
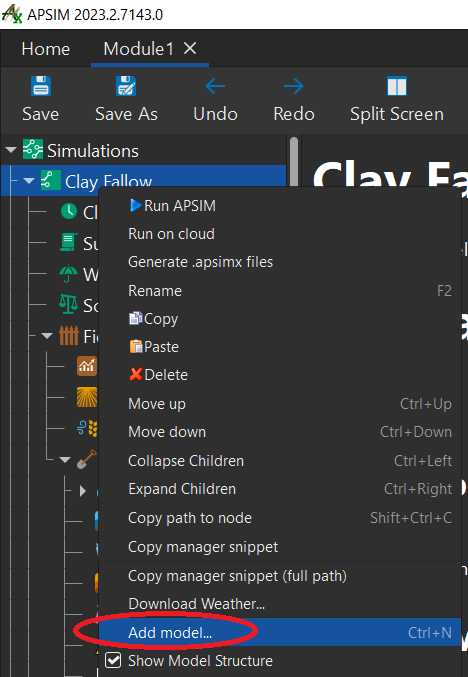
- Double-click "graph" this will add it to the list of nodes.
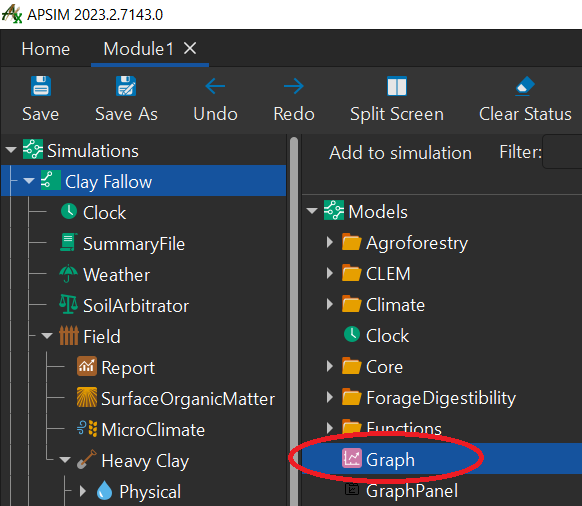
To add data to our graphs we will add "series" to our graph. To do this:
- Right-click "graph"
- Click "Add model..."
- Double-click "Series"
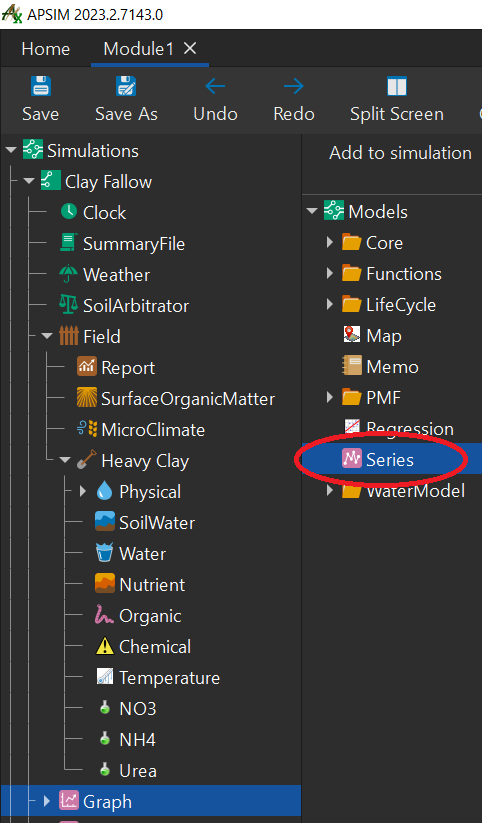
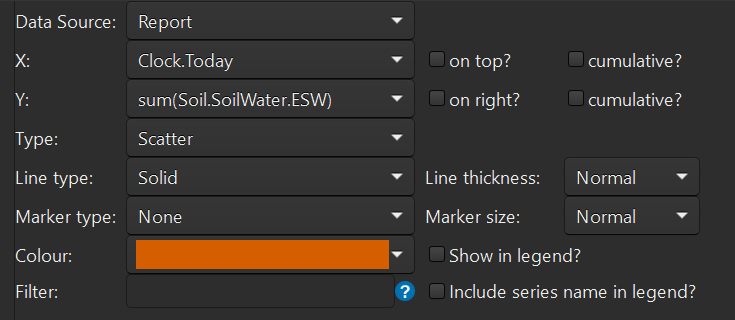
Click "Series". Rename it to ESW.Now we will change the specifics for this series.
- In the
Data Sourcedrop down menu, selectReport. - In the
Xdrop down menu, selectClock.Today. - In the
Ydrop down menu, selectsum(Soil.SoilWater.ESW). - In the
Typedrop down menu, selectScatter. - In the
Line Typedrop down menu, selectSolid. - In the
Marker typedrop down menu, selectNone. - In the
Colourdrop down menu, select orange. - Your ESW series variables should now look like this:
- In the
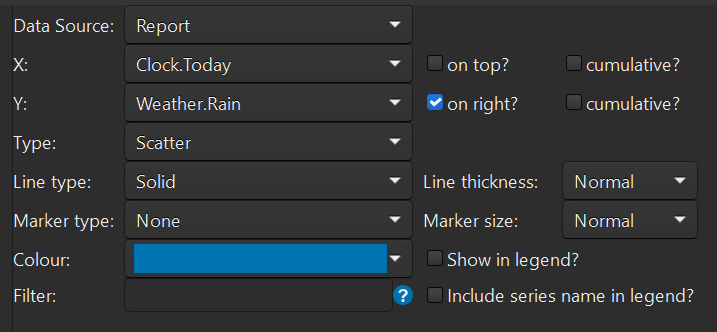
Let's add another series to the "Graph" node. Rename it "Rain".
- In the
Data Sourcedrop down menu, selectReport. - In the
Xdrop down menu, selectClock.Today. - In the
Ydrop down menu, selectWeather.Rain.- Also, tick the "on right?" checkbox. This will add it to the right side of the graph.
- In the
Typedrop down menu, selectScatter. - In the
Line Typedrop down menu, selectSolid. - In the
Marker typedrop down menu, selectNone. - In the
Colourdrop down menu, select blue. - Your Rain series variables should now look like this:
- In the
If we click on the "Graph" node now it will display all the data like so
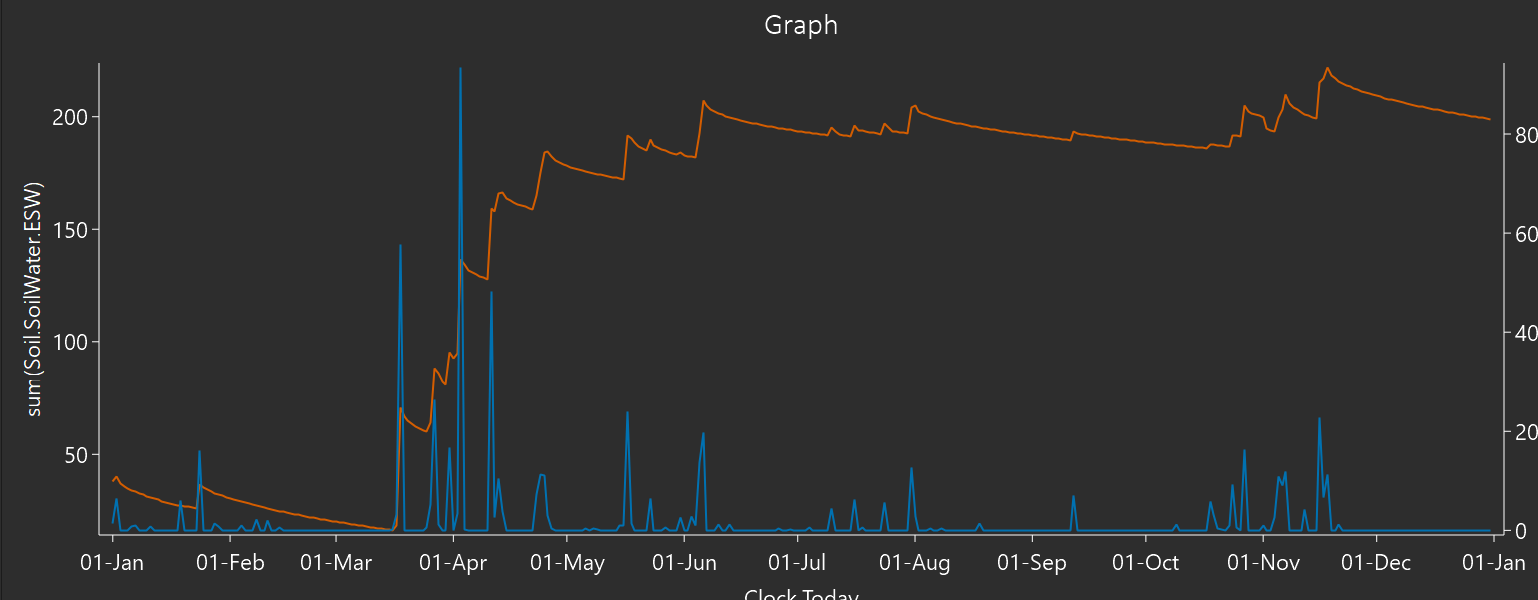
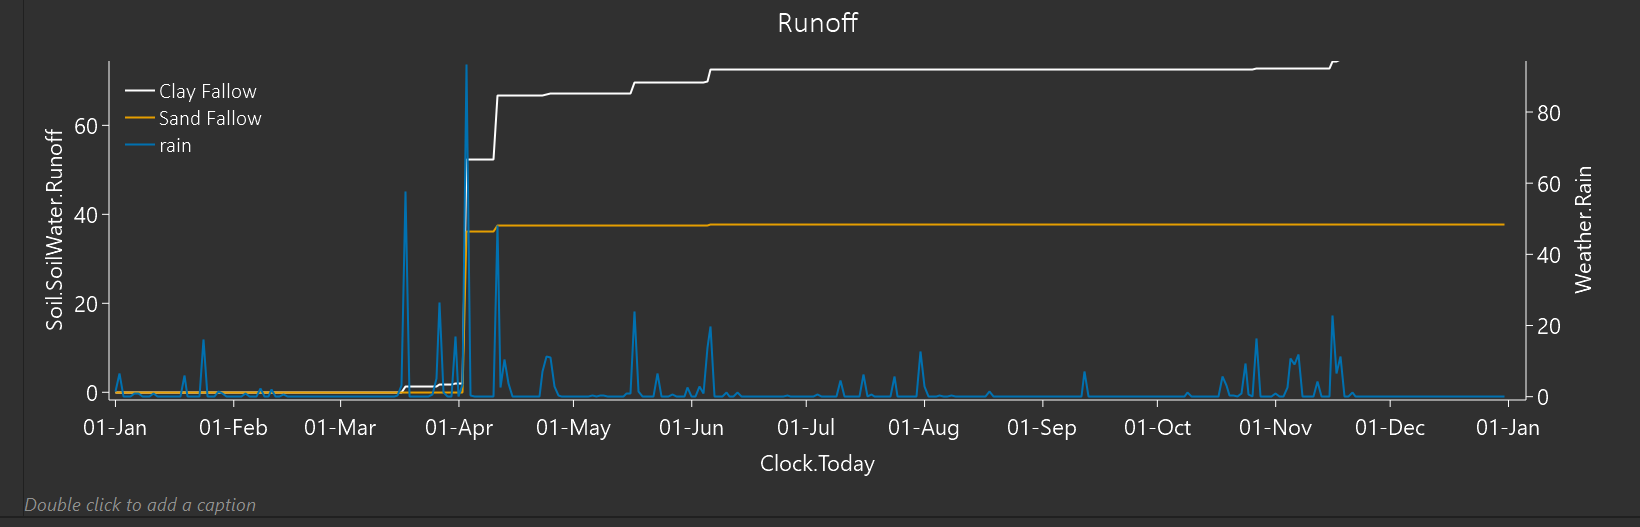
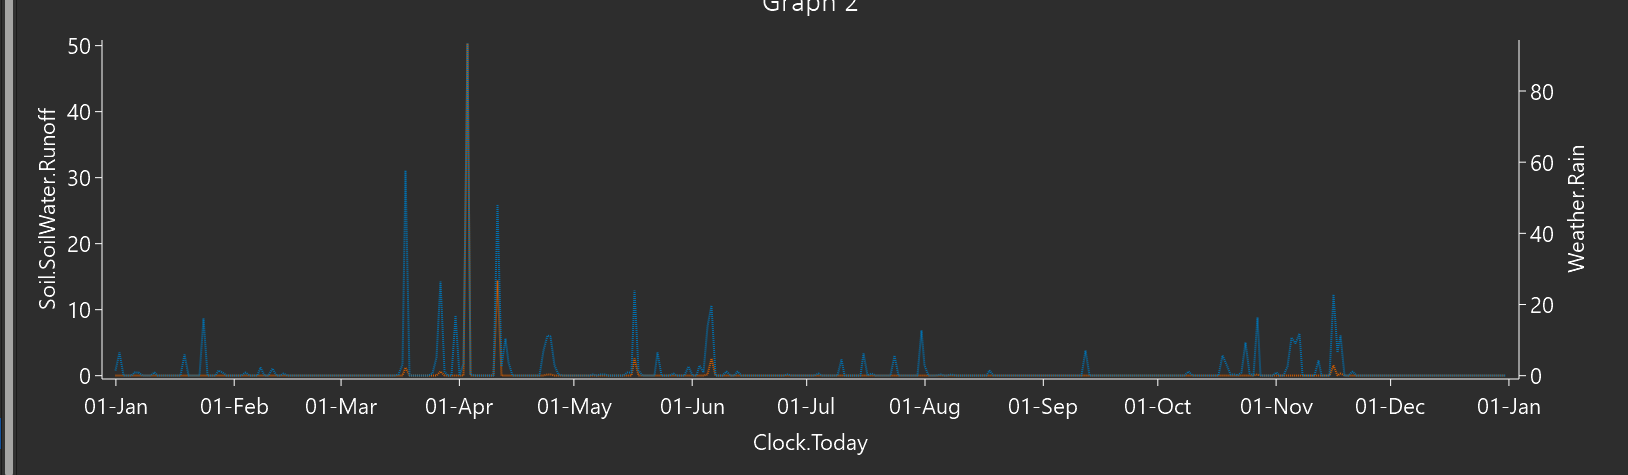
Try to create a graph of Date vs Runoff and Rain (right hand axis). - Change the line type to "Dot". - Tip: you can copy a graph by dragging it to the node where you want it to appear. - Try copying your graph to the "Simulation" node and then edit the new one. - It should look like this:
Comparing Simulations
Quite often you will want to examine differences between multiple simulations. Let’s examine the effect of runoff on the water balance of two different soil types. To do this, we’ll copy our simulation to create a new one exactly the same.
Drag the "Clay Fallow" node up to the top simulations node. Now drop it on the node to create a copy.
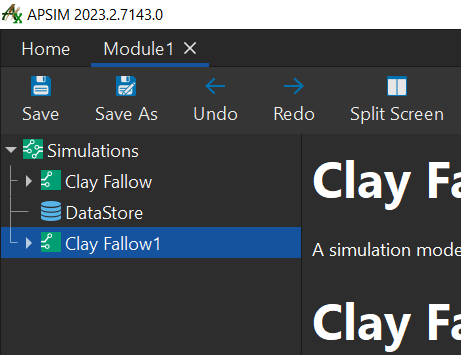
Rename this new simulation "Sand Fallow".
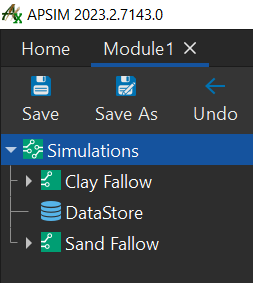
In Report for the Sand Fallow Simulation, remove the report variable named
[Weather].Rain. This avoids making the rain line return to the start of the graph.Drag the Sand soil from the Training toolbox onto the "Field" node under the new Sand Fallow simulation. Then delete the Heavy Clay soil.
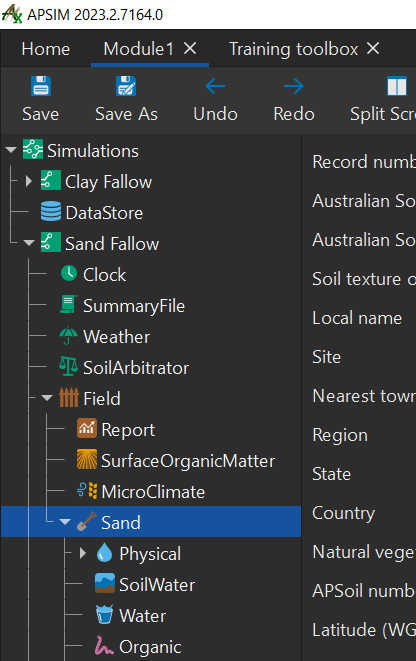
Since we have a new soil we need to set initial water and nitrogen again.
Click "Water" node and change variable "percent full" to 10% and check "filled from top?"
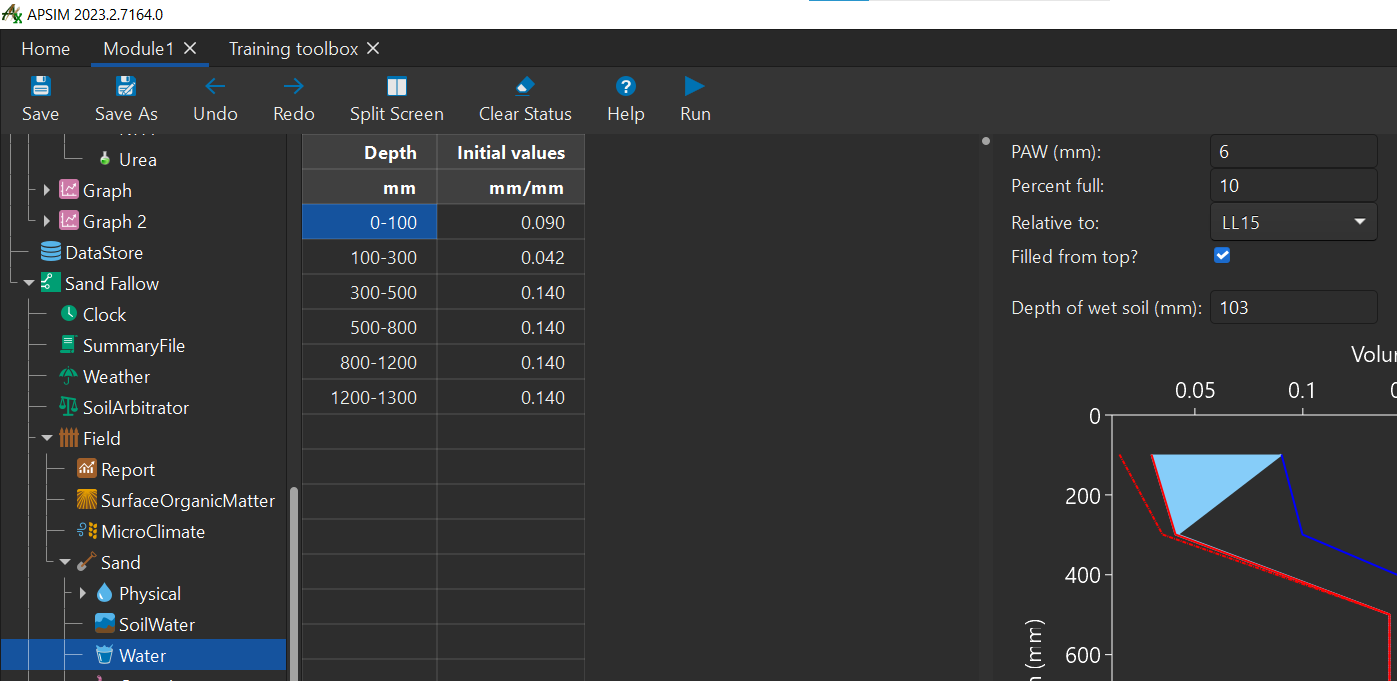
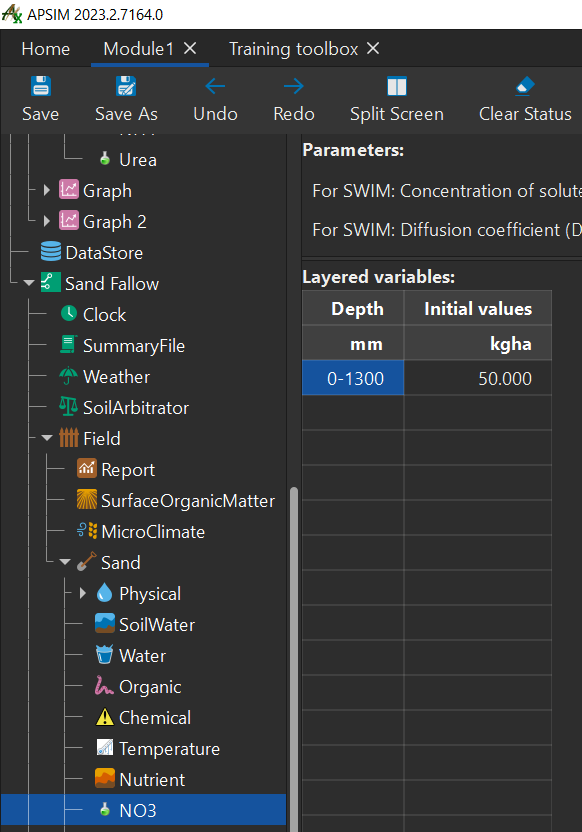
Click "NO3" node and change "0-2000" Depth value to: "0-1300".
Change "ppm" to "kg/ha" by right-clicking "ppm" and clicking "kg/ha".
Change the "initial value" to 50 and press enter.
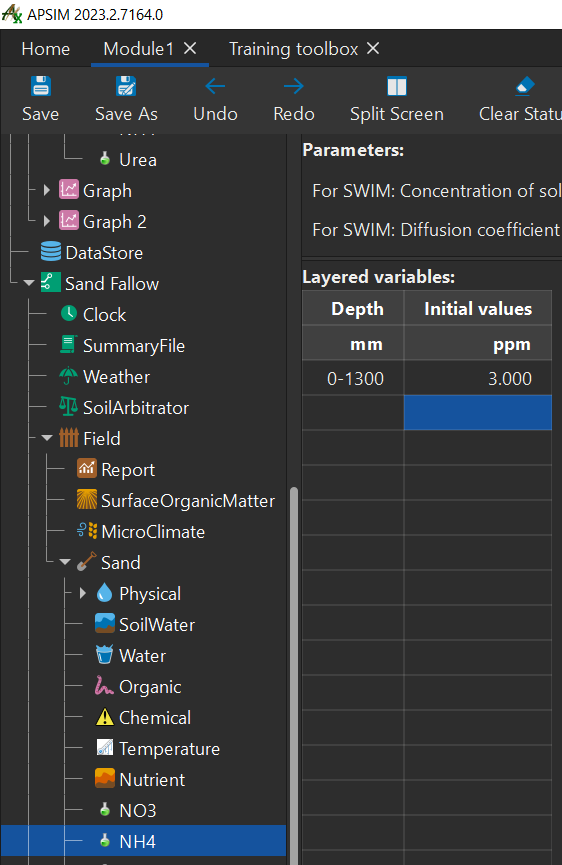
Next, click "NH4" node and change the "ppm" value to "kg/ha" like we did above with "NO3" node.
Change Depth to "0-1300" and "initial value" to "3".
Your nodes variables should look like below:
NO3
NH4
Graph both Simulations
- Next, run APSIM.
- Let's graph both the simulations together. To do this:
- Right-click "Simulations" node at the very top of the left panel.
- Click "Add model..."
- Double-click "Graph"
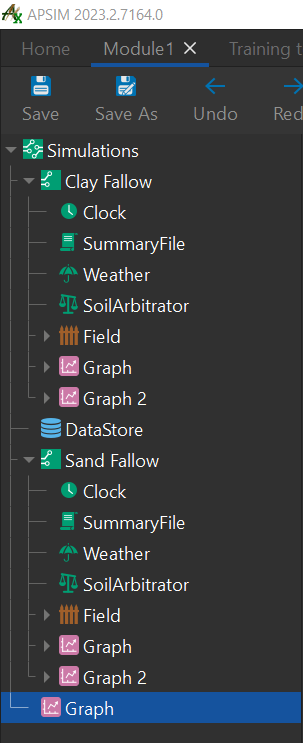
- Let's rename it "Runoff".
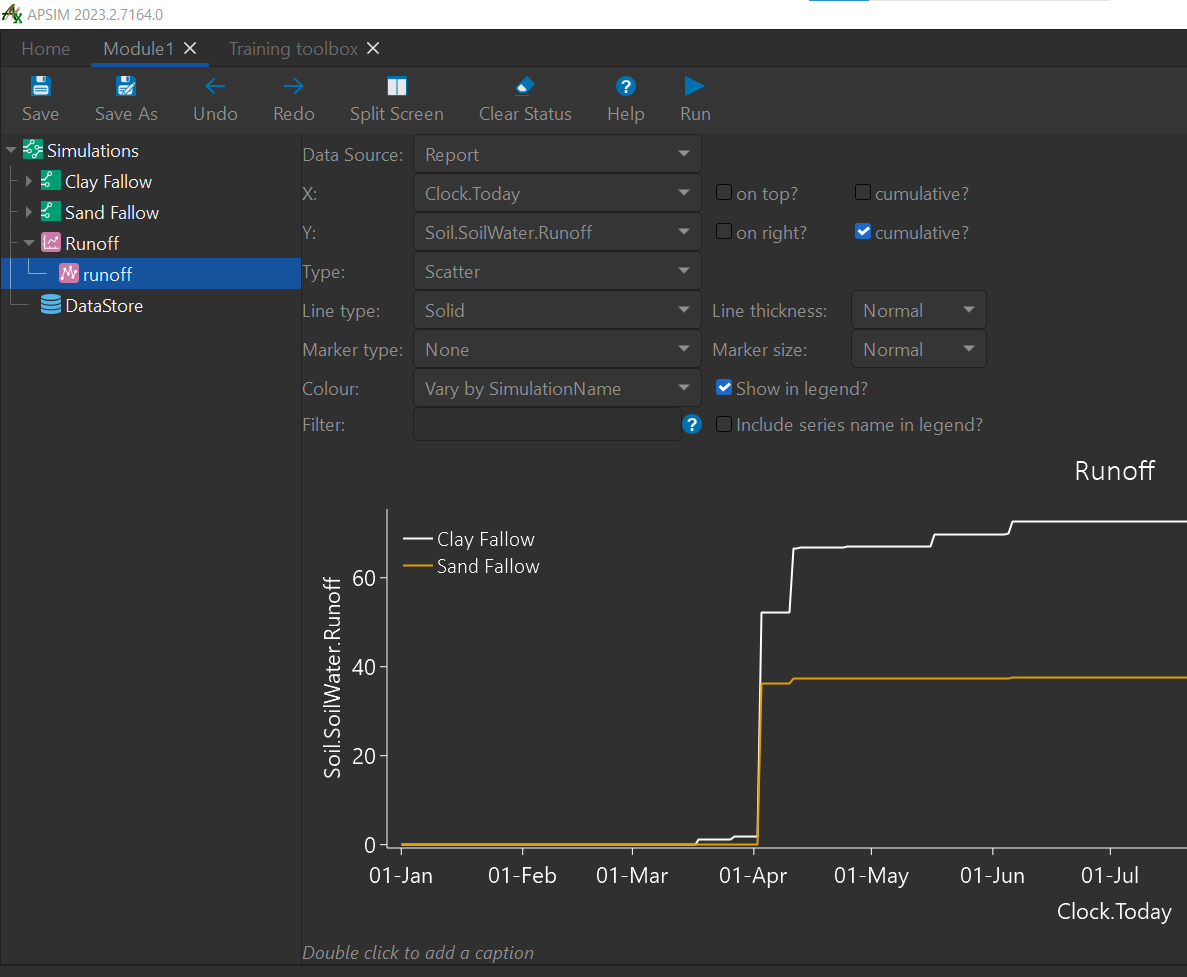
- Let's add a series to this graph by right-clicking the "Graph", clicking "Add model...", and double-clicking "Series".
- Rename the series "runoff" and change the variables to match the image below.
- Add another "series" to the "Runoff" graph and rename it "rain".
- Change the variables to match the image below>
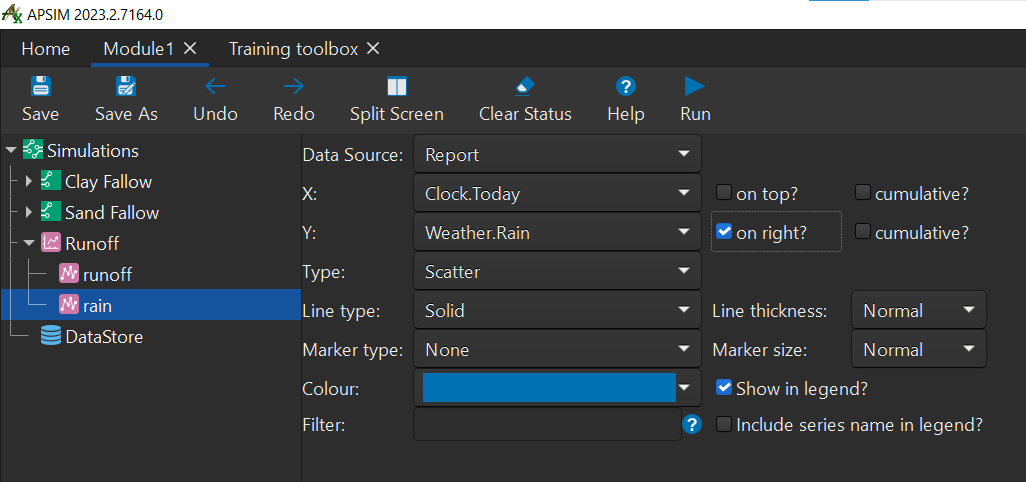
- Now we have a graph showing the runoff of both soils.