
Module 5: Long-term simulations
IMPORTANT NOTE: It is highly recommended that you upgrade your APSIM Next Gen version to at least version 2023.2.7164.0 or later.
Long-term Simulations
Chickpea sowing rates - 40 year runs
In this exercise you will use sowing rules to plant Chickpea crops and observe yield probabilities for a 40 year period given a half full soil moisture profile at sowing. We will compare two sowing rate strategies for these conditions with the goal of maximising yield. The weather will be different each year but the soil starting conditions will be the same.
By default, in long term simulations (i.e. longer than one year), the end of one years' simulation becomes the starting point of the next year. This is useful if you are interested in seeing the degradation or improvement of the soil over a long time period. But what if you wanted to work out what the best strategy would be for the current year using weather scenarios from the past 40 years? To do this we could create 40 different simulations all with the same starting conditions but a different weather file (which would be a lot of work), or we could run the same simulation over 40 years and just reset the starting conditions each year (much simpler).
We can then try different management strategies to see which one would have worked best under the past 10 years weather scenarios.
- Start a new simulations using
Wheatexample. - Rename the
simulationasChickpeaand save the simulation asModule5. - Change the
Clocknodes' start and end date values to:1/01/1940and31/12/1980 - Copy the
Heavy claysoil from theTraining toolboxand delete the exisitingSoilnode. - Set the starting
Waterto50%full - filled from top. - Set NO3
Depthto0-1800andinitial valueto20kg/ha(right-click heading to change units). - Set NH4
Depthto0-1800andinitial valueto0kg/ha. - Change the
SurfaceOrganicMatternode's type to sorghum (don't forget to rename the pool name tosorghumas well), initial surface residue:550 kg/ha, Carbon:Nitrogen ratio of76, leave the Fraction of residue standing as is. - Right-click
Fieldand add aChickpeaplant node. All plants are found under thePMFfolder. - Delete
Wheat. - In
Sow using a variablechange the values to match the following: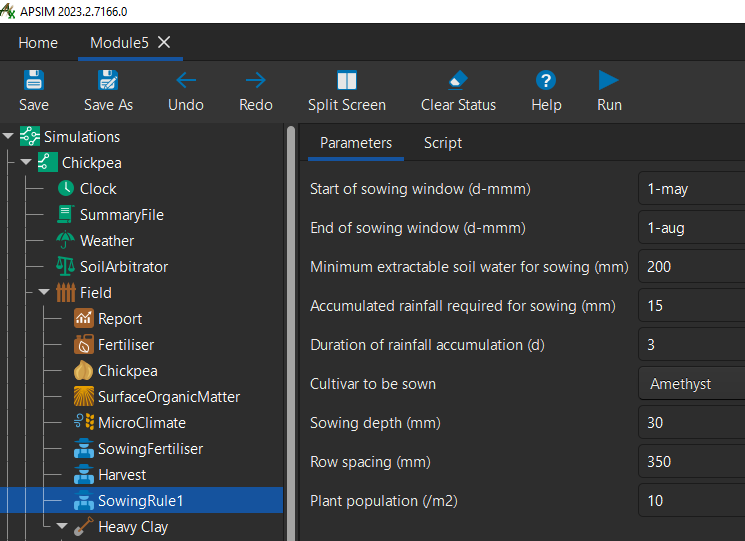
- Run the simulation.
- You should get an error that at it's end says:
.Chickpea.Field.Report can not find the component: [Wheat]. This means we need to update the report variables and report events inReport. Let's change any that have[Wheat]to[Chickpea].- Remove
[Chickpea].Grain.Protein. - Change the report variable
[Wheat].Phenology.Zadok.Stageto[Chickpea].Phenology.Zadok. - Also, remember to change the report event down the bottom
[Wheat].Harvesting.
- Remove
- Run the simulation again.
- You should get an error with the message: Cannot find a soil crop parameterisation called ChickpeaSoil
- This is caused by using a soil that is missing a
SoilCropnode (located underPhysical) with the same name as the plant node you are using. For now, create a copy ofWheatSoilunderPhysicaland rename itChickpeaSoilto fix this exception.
- This is caused by using a soil that is missing a
- Before we run again, let's update our
Harvestmanagement node to look for the correct crop, now thatWheathas been removed andChickpeahas ben added. - Your simulation should now run successfully and you should have data in your
DataStorenode.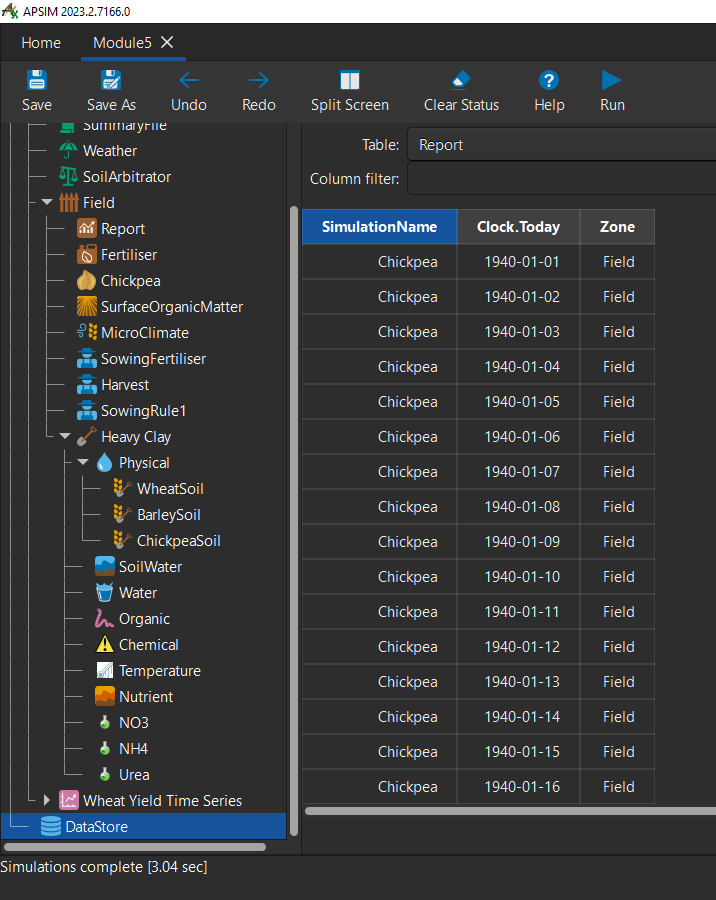
- Add a management script called
Reset on dateto theChickpeasimulation (found inManagement ToolboxunderOther)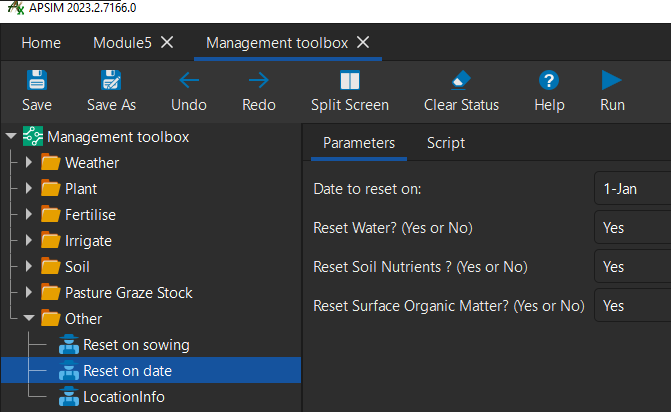
- Leave all parameters as yes and change the
date to reset onto1-may.- note: make sure this management script sits above all other management scripts in the tree as they are ran in the order they are arranged from top to bottom.
- Remove the
Fertilise at sowingmanager node. - Rename the
Chickpeasimulation asChickpea 10 plants. - Copy
Chickpea 10 plantsand rename itChickpea 15 plants. - Change the
Plant population(/m2)to15in theSowing using a variablemanagement script. - Right-click the
DataStoreand clickEmpty the datastore. This makes sure that we have the most up to date data once we run, then run the simulations. - Create a graph under
Simulations. Rename itTotal chickpea yield time serieswith a series that plots[Clock].TodayandYield. - Now you have a graph showing yield when comparing differing plant density over 40 years.
- If you've copied the graph settings from the image below and you can't see both simulations data displayed. Make sure
Chickpea 15 plantssits aboveChickpea 10 plantsin the tree.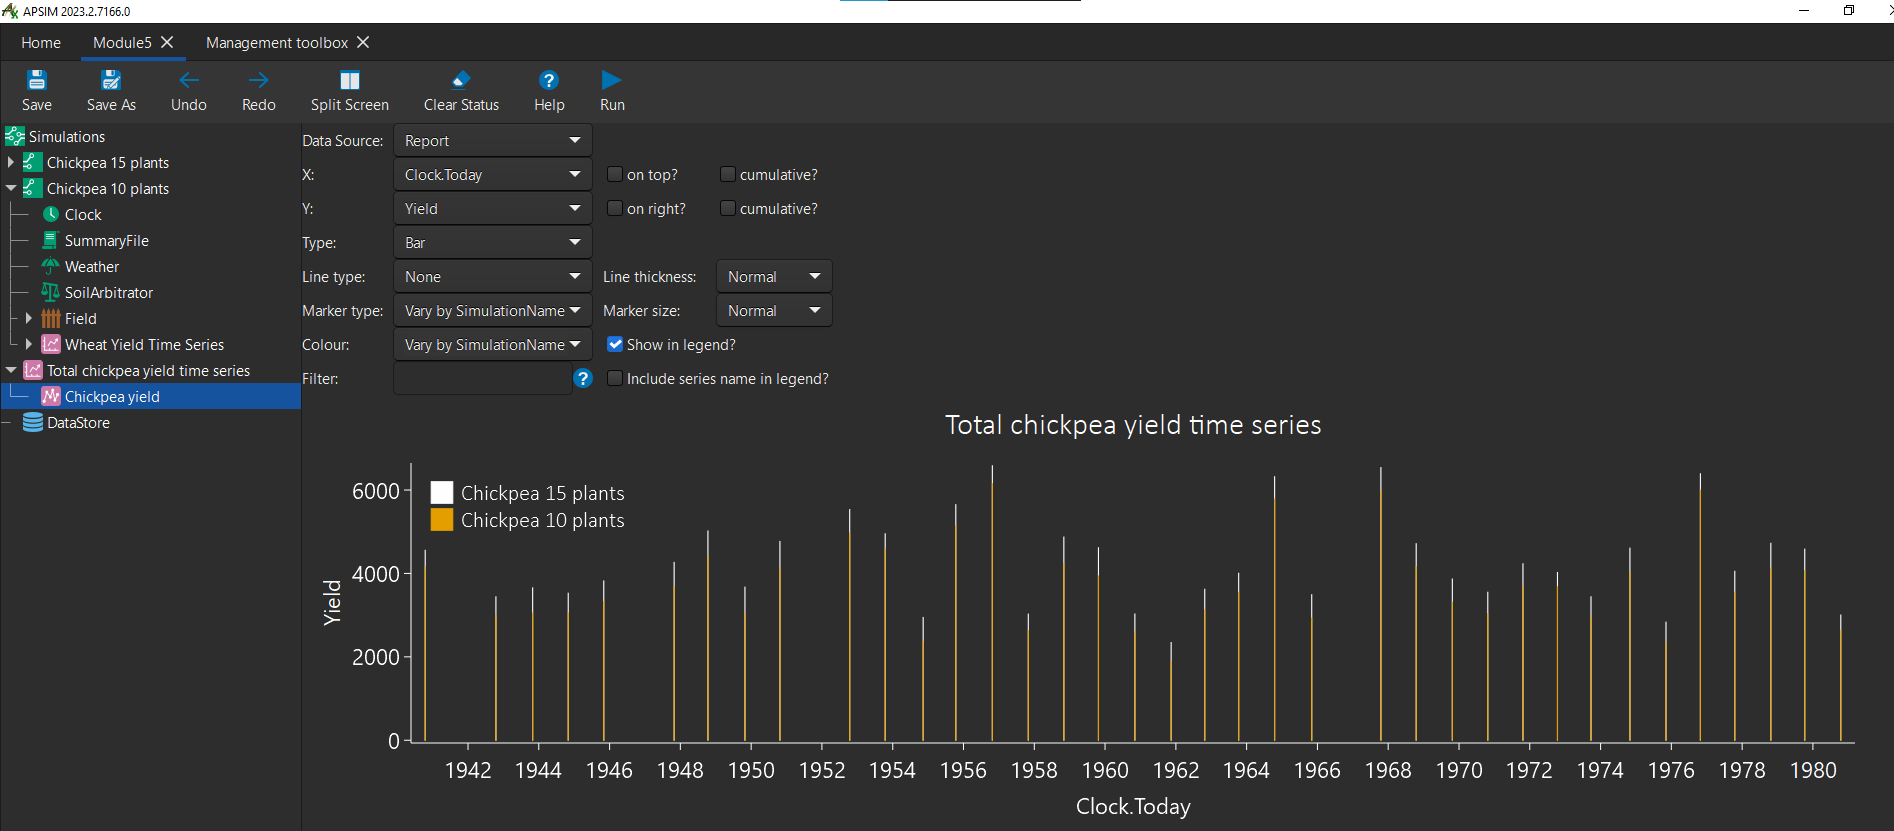
- If you've copied the graph settings from the image below and you can't see both simulations data displayed. Make sure
Note: If you found any incorrect/outdated information in this tutorial. Please let us know on GitHub by submitting an issue.
Created 07/03/2023 - Last updated 05/03/2023